 Group items tagged


Books Direct, "20 Fabulous alternatives to the word 'awesome'." - 4 views
-
A good infographic to assist students to broaden their vocab

Interesting Graphic on Bloom's Taxonomy ~ Educational Technology and Mobile Learning - 0 views
-
A simple and effective infographic explaining Bloom's Revised Taxonomy. A useful guide for teachers and students
A Must See Graphic on Creative Commons for Students ~ Educational Technology and Mobile... - 2 views
-
"A good infographic here that clearly and simply explains Creative Commons and how it works, It visually captures the main concepts of CC for better student understanding.
http://www.knowledgeworks.org/sites/default/files/A-Glimpse-into-the-Future-of-Learning... - 3 views
-
Infographic that attempts to visualise the future of learning
Let the Students Set the Rules | An Ethical Island - 3 views
-
Spend time the first class creating rules with the class. It starts the students thinking , bonding, and taking responsibility for their own education. The infographic here gives you a good framework
Managing your Digital Footprint - Technology Enhanced Learning Blog - 3 views
-
An infographic that explians in simple terms 4 things that you need to know to help your students manage their online reputation
Blended Learning: 10 Trends - 2 views
-
Infographic summarising learning trends. Research is indicating that complementing or replacing teacher-centred with student-centred learning offers improved learning. Lessons that are technology-enabled and offer learning strategies and learning guidance rather that memorization and repetition improves learning, supports knowledge retention, and raises achievement. These methods seem to encourage engagement and are a way to connect with all students whatever level they are at.
27 Ways Teachers Can Facilitate Learning in Today's Classrooms ~ Educational Technology... - 2 views
-
"This infographic that features 27 ways teachers can guide and facilitate student learning.
Feedback Please - Events in Instruction- Event #7 | An Ethical Island - 1 views
-
Infographic - Feedback please - some very useful tips/ideas for obtaining feedback from students
A Step-By-Step Visual Guide To Being An Effective Instructor | Edudemic - 8 views
-
A nice infographic offering a visual Step-By-Step guide to assist teachers who want to give effective Instructions
RSCON4 Presentation PowerPoint (yes I am using a ppt…) | An Ethical Island - 0 views
-
A great way to explain how infographics can be used in education
How to Create a Powerpoint Presentation that Won't Put People to Sleep [Infographic] | ... - 2 views

6 Die: Family Food Consumption... By Country - 4 views
 Cached
-
A fascinating infographic that shows in images the weekly food consumption of families from around the world.
Education 2.0 - Social Networking and Education | Knowledge Is Social - 3 views
-
A neat infographic that shows the use by US schools of social networking tools
7 Creative and Interesting Infographics about Twitter | TechXav: We Teens Love Tech - 4 views
-
This page has 7 great graphics related to Twitter use and Twitter users. Great for anyone interested in the Twitter phenomenon.

A Great Way to Teach Cell Phone Etiquette [Infographic] - Tech the Plunge - 4 views
-
"this nice infographic from Personal Communications Electronics is a great place to start teaching your students (family members as well?) about cell phone etiquette."
The True Size Of Africa - 5 views
-
Brilliant infographic from Kai Krause (perhaps the Kai Krause?) to combat rampant 'immappancy'
-
Good comparison to work out the real size of Africa.
http://www.readwriteweb.com/assets_c/2011/01/Twitterverse-26752.php - 0 views
-
Twitter's importance as an ecosystem can't be underestimated. Sociologist Brian Solis and data visualization specialists JESS3 have got together to create an infographic that shows just how big it's become. This version is interactive with each application link active.
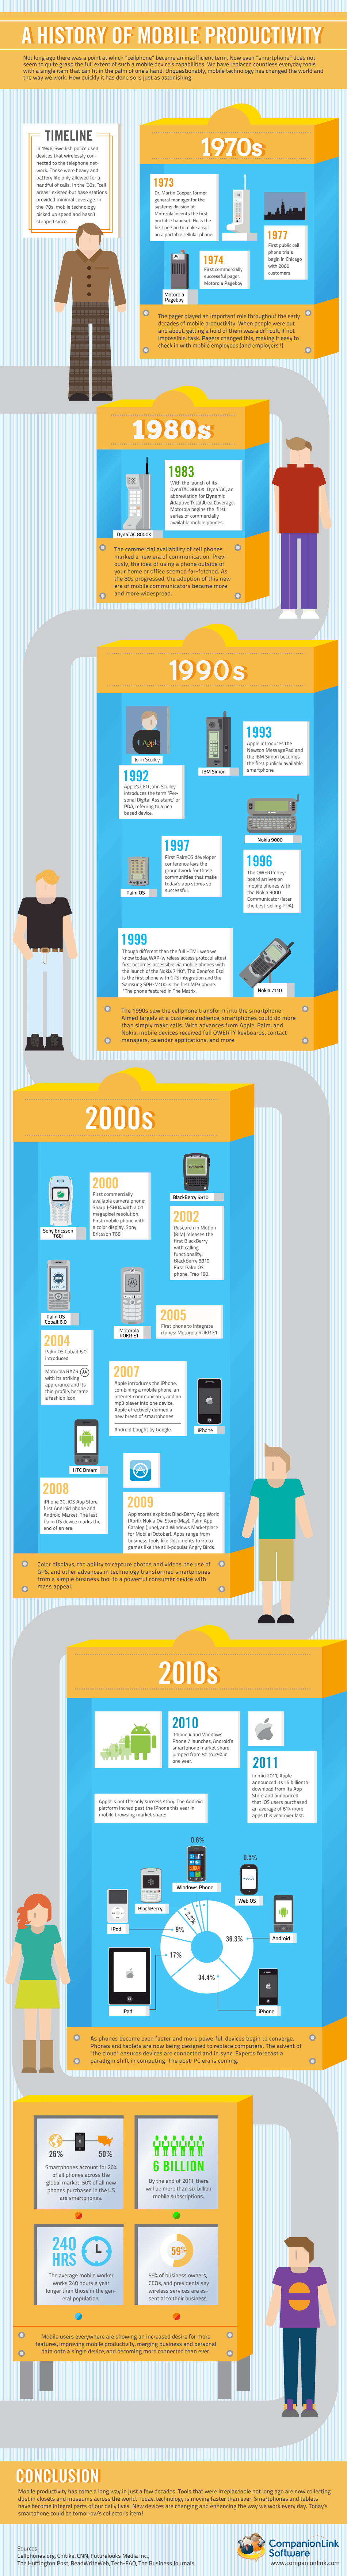
http://www.companionlink.com/blog/wp-content/uploads/2011/08/HistoryOfProductivity.png - 0 views
-
The infographic follows the history of mobile productivity. From the first portable handset. the groundwork for today's app stores laid in the 1990s to today's devices smartphones and tablets.
« First
‹ Previous
41 - 60 of 123
Next ›
Last »
Showing 20▼ items per page