 Group items tagged


Map of UK Renewable Electricity Sites - 1 views
-
"The map shows operation renewable electricity sites over 0.01 MW listed in the Department of Energy and Climate Change's RESTATS Planning Database extract, downloaded on 30 December 2013"

Big Picture: Google Visualization Research - 3 views
-
"Google Research group that explores how information visualization can make complex data accessible, useful, and even fun. Our work includes public and Google-internal projects. Here is some of our public work. "
U.K. National Grid status - 0 views

itsallaboutart: Visual Note Taking - 4 views
-
"Our notes should be true to us, capture what we want to remember or to share and be produced in a simple way that works for us at the time."
If It Were My Home - 2 views
-
"Use our country comparison tool to compare living conditions in your own country to those of another."
BBC - Dimensions - 9 views

The State of the GeoSocial Universe [INFOGRAPHIC] - 0 views
-
The graphic below pits our social network usage against the huge adoption of mobile phones - currently at 4.6 billion worldwide. Facebook, with over 500 million users, is still around 10 times smaller than the worldwide mobile market. Even web-based e-mail, which accounts for over 800 million users collectively, barely holds a candle to the mobile juggernaut. The key here is convergence. Where do all these social platforms intersect with mobile, thus becoming "GeoSocial?"
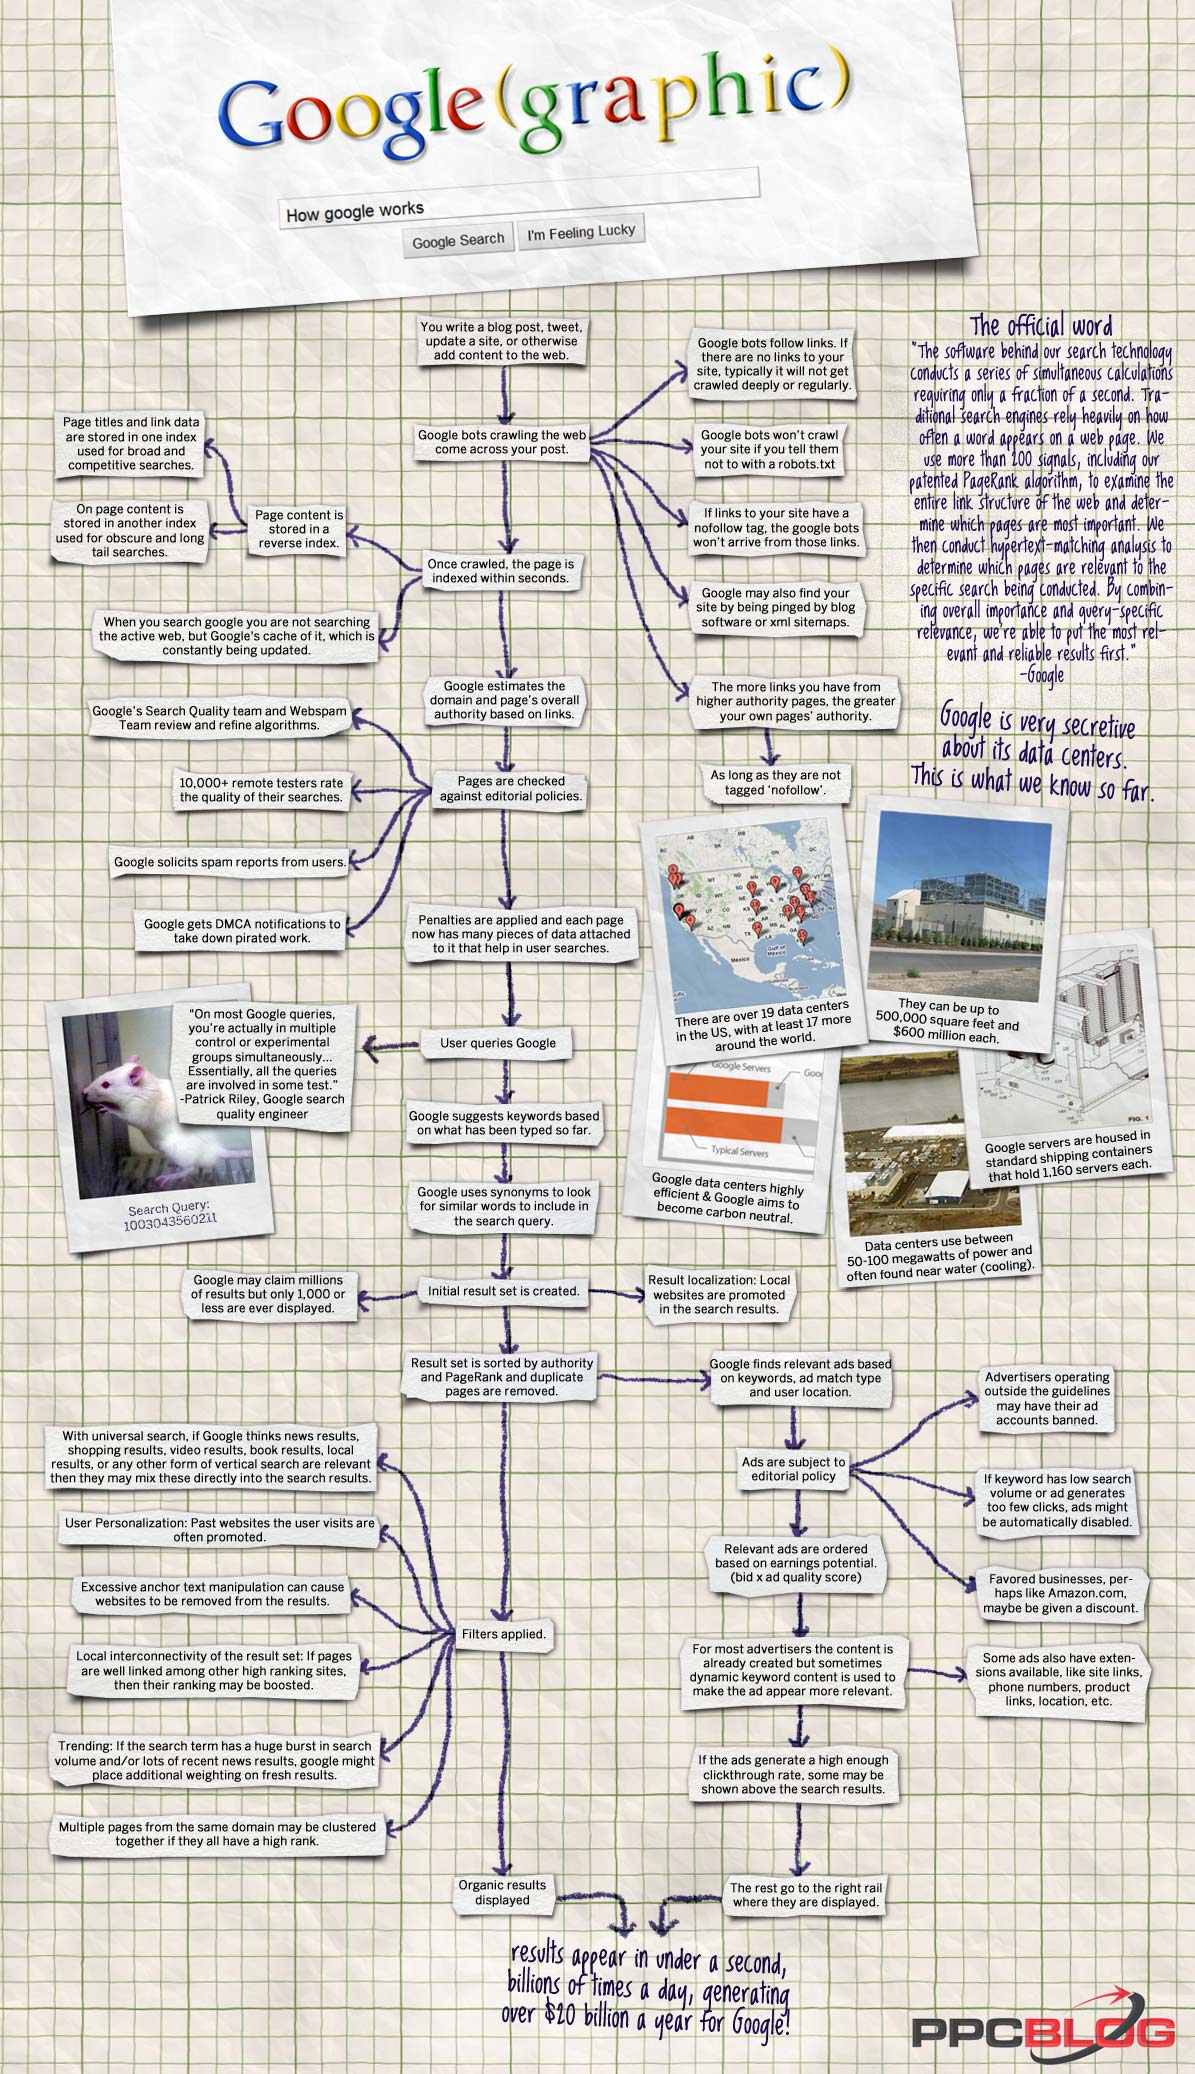
how-google-works.jpg 1195×2074 pixels - 0 views
National Public Toilet Map - 2 views
-
The National Public Toilet Map (the Toilet Map) shows the location of more than 14,000 public and private public toilet facilities across Australia. Details of toilet facilities can also be found along major travel routes and for shorter journeys as well. Useful information is provided about each toilet, such as location, opening hours, availability of baby change rooms, accessibility for people with disabilities and the details of other nearby toilets.

Next Generation Data Visualization. - UUorld - 0 views
-
Standalone app for the visualisation of world data by various measures. Some data sets span a number of decades. Very useful for discussing global trends. eg energy use, medical stats, forestation etc

Imagination Cubed - 5 views
-
 Collaborative drawing tool. No login. Simple to use and share. Fast to get started. Suitable for simple drawings using some basic shapes provided including word bubbles. Endless possibilities for ESL and other simple classroom visualising activities.
Tableau Public - 11 views
-
Tableau Public is a free application that brings data to life. Create and share interactive charts and graphs, stunning maps, live dashboards and fun applications in minutes then publish anywhere on the web. Anyone can do it, it's that easy-and it's free.
Arizona State University Decision Theater - 4 views
-
Decision Theater is a world-class research facility and decision lab for exploring and understanding decision-making in uncertain times. By using state-of-the-art visualization, simulation and solutions tools, we enable decision-makers to address today's challenges and conquer tomorrow's emerging issues.
Fukushima disaster Timeline - Dipity - 9 views
-
Find, create and embed interactive timelines. Dipity is a free digital timeline website with a mission to organize the web's content by date and time. Users can create, share, embed and collaborate on interactive, visually engaging timelines that integrate video, audio, images, text, links, social media, location and timestamps.

Visible Tweets - Twitter Visualisations. Now with added prettiness! - 6 views
-
A visual representation of tweets for public spaces. Could be used in a school foyer or an office space.
World Population Clock: 7 Billion People - Worldometers - 5 views
-
The above world population and countdown counters are based on the estimates of the United Nations and will show the same number wherever you are in the world and whatever time you set on your PC.
Learn ArcGIS - 1 views
-
"This is a website for self-study learning about the application of geographic information systems (GIS) through realistic hands-on projects. Come here to explore interactive maps, make your own maps, and learn how to solve geographic problems."
LLNL Flow Charts - 2 views
-
"Flow charts, also referred to as Sankey Diagrams, are single-page references that contain quantitative data about resource, commodity, and byproduct flows in a graphical form. These flow charts help scientists, analysts, and other decision makers to visualize the complex interrelationships involved in managing our nation's resources."
Closr - 2 views
-
"CREATE ZOOMABLE STORIES FROM YOUR BIG IMAGES Discover a new way to interact with high-resolution images and get your audiences engaged."
« First
‹ Previous
41 - 60 of 67
Next ›
Showing 20▼ items per page