
Home/ ENGL 481: Digital Humanities/ Group items tagged charts

Rss Feed Group items tagged

Karissa Lienemann

Simulating History- Yellowjacket Software - 0 views
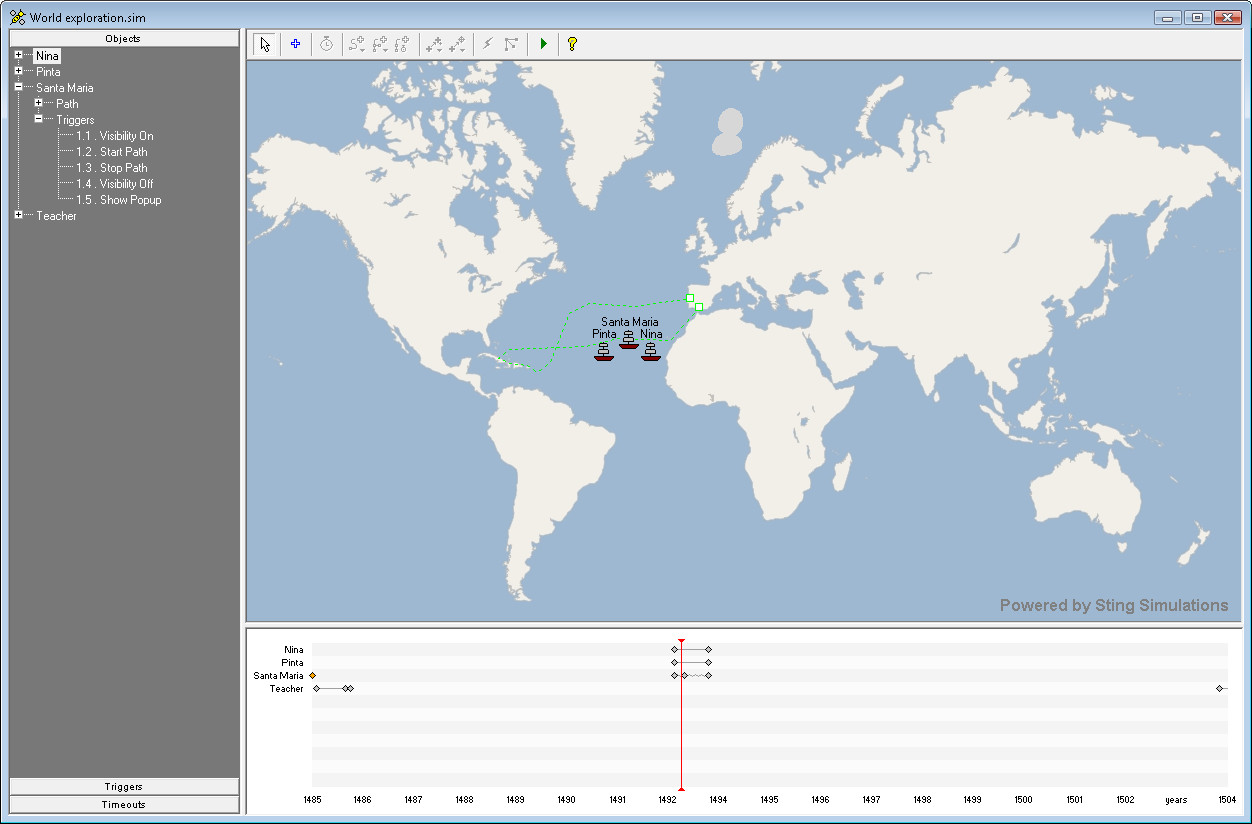
  •  
    Kevin Colton explains how the use of simulation can increase the fundamental learning of history. By using charts, maps, diagrams, and photos, students can get a different and more effective learning experience. He also goes on to explain the basics of how he created the simulation and gives images to give you an idea of what the maps might look like and a demo simulation video.
Megan Lightsey

Digital Keys for Unlocking the Humanities' Riches - 2 views

Digital humanists are arguing that it is time to set our focus on how technology is changing liberal arts. Civil War battlefields are being mapped. Animation, charts and primary documents are being...

mlightsey surprise map NEH NSF

Karissa Lienemann

Simulation for Education - 0 views

  •  
    This article explains how, with the use of digital humanities and simulations, historians will be able to use animation archives to teach history to students. Like a lot of students, both young and old, we are visual learners. By the use of maps and charts and pictures, one can better understand what is being taught, in this instance it will be history. The picture shown here is an example of what students will use.
Andrea Verner

Enhancing Teaching and Learning Practices with Digital Mapping Approaches - 2 views

  •  
    A professor came and spoke to students and faculty about how students in higher education can integrate mapping tools into the classroom. They use these projects as organizational templates, spatial analysis, metaphors, graphs, and charts. She posts questions that should be asked before choosing the mapping approach for their projects.
Esther Ok

Great Tools for Data Visualization - 1 views

  •  
    This short article focuses on how visualizing data can be advantageous for the public and what kind of softwares can be used to create such projects. For instance, software "Tabeleau Public" is a desktop application that can post graphs, maps, and table sinto the web. "Flare" is a software relying on Flash and can create interactive data shared with other users. This article basically reveals the many ways to visualize data other than through the use of Microsoft Excel.
1 - 5 of 5
Showing 20 items per page