Really nice. Be great to see the two combined – heatmaps and topography or atleast some kind of colour banding added to the topography. That would open up all kinds of possibilities – you could slice horizontally along the bands and create layers of different ranges. In fact mixing colour and topography would also give you a way of showing two sets of data concurrently – topography for prostitution and some kind of colour banding for wealth for example.
Makes the numbers come alive. G
Brilliant work! Can you cross this data with the physical typography? I’ve always been curious if safer neighborhoods are uphill.
It would be interesting to pull the data in from previous decades and see how the elevation has changed in different areas.
@adrian – it’s just raw totals, grouped geographically. These aren’t scientific by any means, I basically took the underlying pattern and extruded it out and smoothed it a bit to make it look “pretty”. But basically each image is the aggregate numbers for a single year of crime data.
@richard – yes, there is some smoothing in effect, which means that the ridge along Shotwell St (for the prostitution map) is indeed a bit smoothed between peaks. That’s not to say that there are only two peaks at Shotwell and 19th and Shotwell and 17th. There are incidents in between as well, but the big peaks at those major intersections does mean that the ridge between them appears higher than the actual incidents along those blocks support.
A lot of people have commented on the usefulness of maps like these. I want to stress once again: this was done as an art project much more than a useful visualization. My goal was not to provide useful information that one could act on.
“one trick pony. these maps add nothing of value to a standard color plot.”
I disagree: allowing for a third dimension of elevation makes the reality of concentration clearer – and half the point of crime mapping is to measure concentration, not simply “intensity.”
Great idea and nice work on the graphics, but there are at least three improvements you should make to reveal *true* patterns. Forgive me if you already did these.
1) Availability bias – normalize for population density (i.e. per capita activity)
2) Sampling bias – normalize for the number of cops on the beat (geographic and crime type)
2) Frame bias – break it up by daytime and night time
I came across Wordle some time ago, thought it was pretty nifty, and then forgot about it. An article in the August 2009 issue of Learning & Leading with Technology ("Words in a Cloud" by Samantha Morra) made me reflect on the power of this fun tool. In the article, Morra describes using Wordle with her middle school students to visually analyze important documents, such as the Declaration of Independence. I began thinking about science and math class and wondered if the tool might help students identify the main concepts of a passage. However, I don't have access to any middle school textbooks to test this out!
If you want to use it as a pre-reading activity, copy and paste your text (or type a few paragraphs) into wordle to create the word cloud. The size of the words indicates the frequency of their use in the text. In essence, major concepts/terms will show up bigger than others. Have students create a prediction about the reading based on what appears in the word cloud.
If you want to use it as a post-reading activity, I have had students keep a running list of words that jump out at them while reading a particular passage (or you can give them a more specific purpose for selecting words). Then, they create their own word clouds. It's a nice formative assessment for teachers to see what students are noticing while reading (or NOT noticing...).
I have also asked students to write a beginning of the year letter to me about themselves. We then "wordle" the letter and print the graphic. I hang the graphics on the wall of the classrooms to show a snapshot of the different people in the class.
the five functions now performed by universities — teaching; providing a space for social interaction; testing students’ knowledge and offering feedback in the form of grades; cultivating a reputation as a good place to learn; and certifying what graduates know through accreditation — will inevitably change.
In October 2003, there were 511 courses available, all from M.I.T. According to Ms. Mulder, the current total is over 21,000 — with 9,903 in languages other than English, including Chinese, Spanish, Portuguese, French, Catalan, Hebrew, Farsi, Turkish, Korean and Japanese.
The school’s Masters Series Madrid is a game — with soundtrack, 3-D graphics and interviews with executives — that allows students to manage an international tennis tournament.
“It’s a great way for people to see our school,” said Matthew Constantine, a member of the IE staff.
Although all of the material on IE’s Web site is free for individual use, he said, the school “avoided developing material for self-learning” because “we think class discussion is essential.”
“If you don’t ‘close’ education in certain ways then you are out of business.”
“The completion rates for students in purely online programs are very low,” he said. “If a program is too open, too flexible, too ‘on demand,’ students won’t ever finish.”
Mr. Mulder also warned against viewing O.E.R. as a panacea. “O.E.R. is not education,” he said. “It’s only content. It becomes learning when you have good teaching.”
It remains to be seen whether new learning agents and traditionally certified teachers
will cooperate or compete.
Secondly, it emphasizes the need for learning to be an ongoing process
whereby we all become engaged citizens of a global society. T
By embracing technologies of cooperation, prototyping new models of learning, and
cultivating open and collaborative approaches to leadership, “amplified” educators
and learners will become the organizational “superheroes” of schools and districts.
The globalization
of open learning systems characterized by cooperative resource creation, evaluation,
and sharing will change how educational institutions view their roles and will offer
new forms of value in the global learning ecosystem.
The result
will be an emerging toolset for designing personalized, learner-centered experiences
and environments that reflect the differentiation among learners instead of forcing
compliance to an average learning style and level of performance.
As the hierarchical structure of education splinters, traditional top-down movements
of authority, knowledge, and power will unravel. Before new patterns get established,
it will seem as if a host of new species has been introduced into the learning ecosystem.
Authority will be a hotly contested resource, and there will be the potential for
conflict and distrust.
Learning geographies will be accessible to communities through a range of key tools,
such as data aggregated from disparate sources, geo-coded data linking learning
resources and educational information to specific community locations, and visualization
tools that help communicate such information in easily understood visual and graphic
forms. Such information will often contain multiple layers of data (for example,
school performance statistics, poverty rates, and the degree of access to fresh
food).
These new dimensions of learning geographies will require new core skills. Among
them will be navigating new visual cartographies, identifying learning resources
in previously unexpected places, leveraging networks to take advantage of learning
opportunities, and creating flexible educational infrastructures that can make use
of dispersed community resources. Through enhanced visibility and accessibility,
learning geographies will bring new transparency to issues of equity in learning.
By embracing technologies of cooperation, prototyping new models of learning, and cultivating open and collaborative approaches to leadership, "amplified" educators and learners will become the organizational "superheroes" of schools and districts.
They are characterized as preferring teamwork, experiential activities, and the use of technology
Doing is more important than knowing, and learning is accomplished through trial and error as opposed to a logical and rule-based approach.2 Similarly, Paul Hagner found that these students not only possess the skills necessary to use these new communication forms, but there is an ever increasing expectation on their part that these new communication paths be used
Much of the work to date, while interesting and compelling, is intuitive and largely based on qualitative data and observation.
There is an inexorable trend among college students to universal ownership, mobility, and access to technology.
Students were asked about the applications they used on their electronic devices. They reported that they use technology first for educational purposes, followed by communication.
All self-reported. Would have been powerful if could have actually tracked a representative sample and compared actual use with reported use.
presentation software was driven primarily by the requirements of the students' major and the curriculum.
Communications and entertainment are very much related to gender and age.
From student interviews, a picture emerged of student technology use driven by the demands of the major and the classes that students take. Seniors reported spending more time overall on a computer than do freshmen, and they reported greater use of a computer at a place of employment. Seniors spent more hours on the computer each week in support of their educational activities and also more time on more advanced applications—spreadsheets, presentations, and graphics.
Confirming what parents suspect, students with the lowest grade point averages (GPAs) spend significantly more time playing computer games; students with the highest GPAs spend more hours weekly using the computer in support of classroom activities. At the University of Minnesota, Crookston, students spent the most hours on the computer in support of classroom activities. This likely reflects the deliberate design of the curriculum to use a laptop extensively. In summary, the curriculum's technology requirements are major motivators for students to learn to use specialized software.
The interviews indicated that students are skilled with basic office suite applications but tend to know just enough technology functionality to accomplish their work; they have less in-depth application knowledge or problem solving skills.
According to McEuen, student technology skills can be likened to writing skills: Students come to college knowing how to write, but they are not developed writers. The analogy holds true for information technology, and McEuen suggested that colleges and universities approach information technology in the same way they approach writing.6
he major requires the development of higher-level skill sets with particular applications.
Not really quantitative--self-reported data back by selected qualitative interviews
The comparative literature on student IT skill self-assessment suggests that students overrate their skills; freshmen overrate their skills more than seniors, and men overrate their skills more than women.7 Our data supports these conclusions. Judy Doherty, director of the Student Technologies Resource Group at Colgate University, remarked on student skill assessment, "Students state in their job applications that they are good if not very good, but when tested their skills are average to poor, and they need a lot of training."8
Mary Jane Smetanka of the Minneapolis–St. Paul Star Tribune reported that some students are so conditioned by punch-a-button problem solving on computers that they approach problems with a scattershot impulsiveness instead of methodically working them through. In turn, this leads to problem-solving difficulties.
We expected to find that the Net Generation student prefers classes that use technology. What we found instead is a bell curve with a preference for a moderate use of technology in the classroom (see Figure 1).
More information needs to be given to find out why--may be tool and method not engaging.
It is not surprising that if technology is used well by the instructor, students will come to appreciate its benefits.
A student's major was also an important predictor of preferences for technology in the classroom (see Table 3), with engineering students having the highest preference for technology in the classroom (67.8 percent), followed by business students (64.3 percent).
Humanities
7.7%
47.9%
40.2
he highest scores were given to improved communications, followed by factors related to the management of classroom activities. Lower impact activities had to do with comprehension of classroom materials (complex concepts).
I spend more time engaged in course activities in those courses that require me to use technology.
The instructors' use of technology in my classes has increased my interest in the subject matter.
3.25
Classes that use information technology are more likely to focus on real-world tasks and examples.
Interestingly, students do not feel that use of information technology in classes greatly increases the amount of time engaged with course activities (3.22 mean).12 This is in direct contrast to faculty perceptions reported in an earlier study, where 65 percent of faculty reported they perceived that students spend more time engaged with course materials
Only 12.7 percent said the most valuable benefit was improved learning; 3.7 percent perceived no benefit whatsoever. Note that students could only select one response, so more than 12.7 percent may have felt learning was improved, but it was not ranked highest. These findings compare favorably with a study done by Douglas Havelka at the University of Miami in Oxford, Ohio, who identified the top six benefits of the current implementation of IT as
improving work efficiency,
affecting the way people behave,
improving communications,
making life more convenient,
saving time, and
improving learning ability.14
Would have been good to know exactly what kinds of technologies were meant here.
Our data suggest that we are at best at the cusp of technologies being employed to improve learning.
The interactive features least used by faculty were the features that students indicated contributed the most to their learning.
he students in this study called our attention to performance by noting an uneven diffusion of innovation using this technology. This may be due, in part, to faculty or student skill. It may also be due to a lack of institutional recognition of innovation, especially as the successful use of course management systems affects or does not affect faculty tenure, promotion, and merit decisions
we found that many of the students most skilled in the use of technology had mixed feelings about technology in the classroom.
What we found was that many necessary skills had to be learned at the college or university and that the motivation for doing so was very much tied to the requirements of the curriculum. Similarly, the students in our survey had not gained the necessary skills to use technology in support of academic work outside the classroom. We found a significant need for further training in the use of information technology in support of learning and problem-solving skills.
Course management systems were used most by both faculty and students for communication of information and administrative activities and much less in support of learning.
In 1997, Michael Hooker proclaimed, "higher education is on the brink of a revolution." Hooker went on to note that two of the greatest challenges our institutions face are those of "harnessing the power of digital technology and responding to the information revolution."18 Hooker and many others, however, did not anticipate the likelihood that higher education's learning revolution would be a journey of a thousand miles rather than a discrete event. Indeed, a study of learning's last great revolution—the invention of moveable type—reveals, too, a revolution conducted over centuries leading to the emergence of a publishing industry, intellectual property rights law, the augmentation of customized lectures with textbooks, and so forth.
Both the ECAR study on faculty use of course management systems and this study of student experiences with information technology concluded that, while information technology is indeed making important inroads into classroom and learning activities, to date the effects are largely in the convenience of postsecondary teaching and learning and do not yet constitute a "learning revolution." This should not surprise us. The invention of moveable type enhanced, nearly immediately, access to published information and reduced the time needed to produce new publications. This invention did not itself change literacy levels, teaching styles, learning styles, or other key markers of a learning revolution. These changes, while catalyzed by the new technology, depended on slower social changes to institutions. I believe that is what we are witnessing in higher education today.
The institutions chosen represent a nonrepresentative mix of the different types of higher education institution in the United States, in terms of Carnegie class as well as location, source of funding, and levels of technology emphasis. Note, however, that we consider our findings to be instructive rather than conclusive of student experiences at different types of Carnegie institutions.
Qualitative data were collected by means of focus groups and individual interviews. We interviewed undergraduate students, administrators, and individuals identified as experts in the field of student technology use in the classroom. Student focus groups and interviews of administrators were conducted at six of the thirteen schools participating in the study.

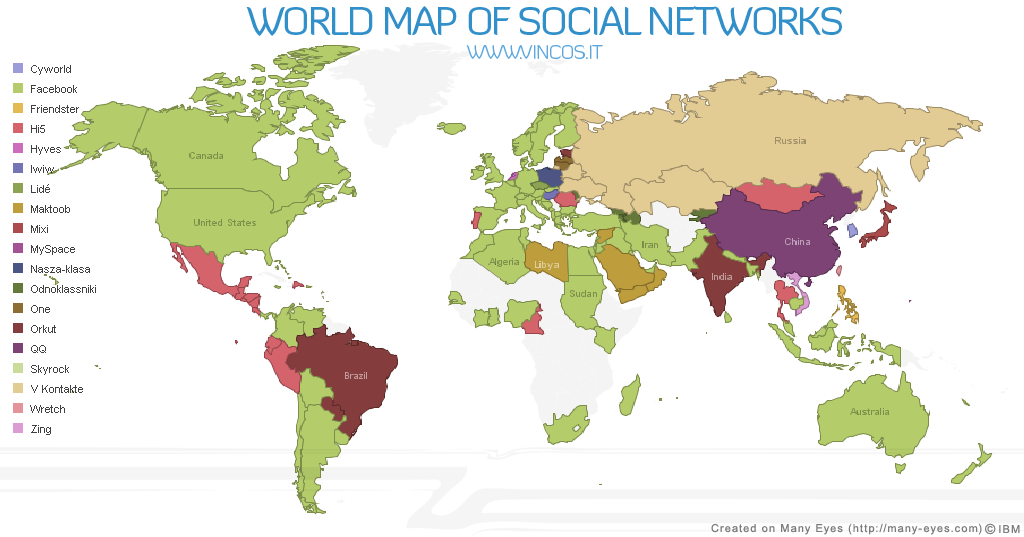
 Barbara Lindsey on 03 Jun 10Nice graphic but critically marred by all rights reserved copyright on it.
 Group items tagged

