Group items matching
in title, tags, annotations or url


What Happens in an Internet Minute? - 0 views


Pampered Pets - 0 views
-
Despite the recession, Americans are spending more on their beloved pets than ever before.

a new iPad means no shuffling between several gadgets | NextWorth - 0 views
-
Ipad 3 infogaphic

Tipping Etiquitte - 0 views

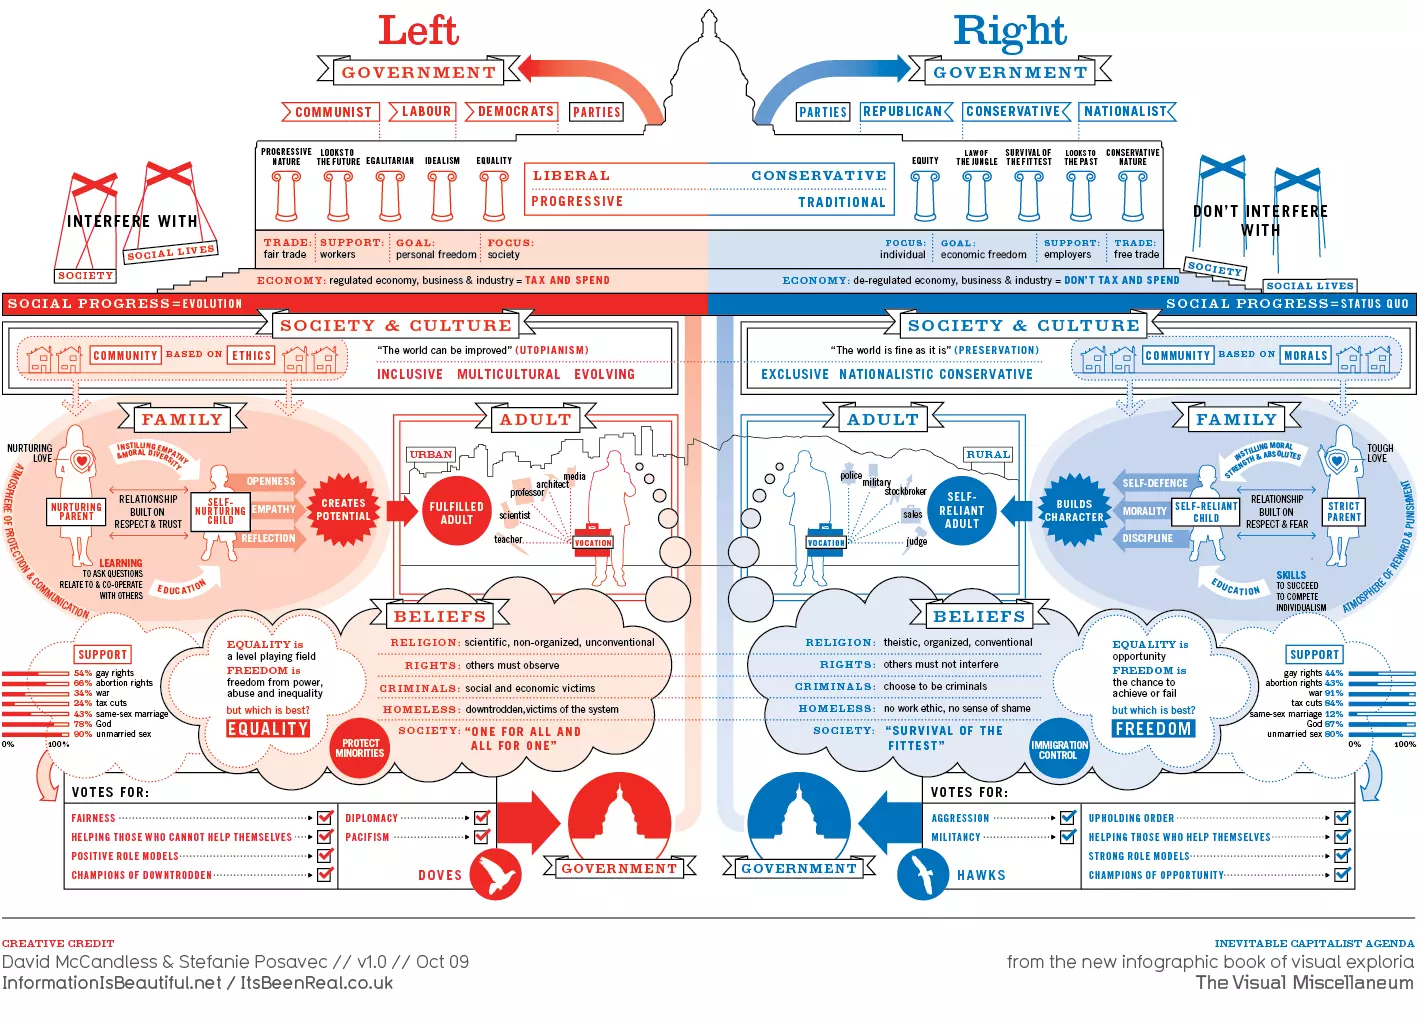
Left Vs. Right Government Parties - 1 views
-
Depicts left vs right political parties. Pretty cool actually!
How Long Will It Last? - 0 views
-
Years left if the world consumes at today's rate vs. years left if the world consumes at the half the US consumption rate.

Bungie.net : Halo Reach Online - 1 views

Robots On The Rise - 0 views


The evolution of the web - 0 views
-
A cool interactive thing about the history of web browsers. This sort of thing is obviously too complicated to do on our presentations, but it's a cool design and several salient design features can be gleaned from it.

Shoplifting Around the World - 0 views

The Learning Power of LEGO - 0 views
-
The Learning Power of LEGO infographic from onlinecollege.org brings to light the uses of LEG...

GOOD.is | The Changing American Dream (Scaling) - 0 views
-
What money means to each generation.

Who is coming to america? - 1 views

Sports & Social Media [infograpic] - 0 views

Visualizing Millions, Billions, Trillions of Dollars - 0 views
-
Where the money goes See: - VSL (Six Things) - state debt in geographic map (Billions) - elections (Millions)

.jpg)

数据家庭农场 - 因特网数据可视化 - 3 views
« First
‹ Previous
41 - 60 of 62
Next ›
Showing 20▼ items per page