 Group items tagged


Visualizing the Decline of Empires: SIGGRAPH 2010 - 2 views
-
My professor showed this video in my Computer Graphics class. Had to share.
-
 A little trippy, and very interesting.
 -
 1960-1980... Can't keep up!

Nuclear Power Plant Statistics - 1 views
-
Unfortunately, not good dataviz on this site, but some of the linked documents do have some charts and scatterplots

How to be a Firefighter - 1 views

Bureau of Labor Statistics Data - 2 views

Musicovery - 10 views
-
 "anyqs" Where are they getting the data for the music? Most listened to on radio? Pandora? Youtube searches? Also, what does the size of each square represent?
 - ...1 more comment...
-
 anyqs Is there any definition to the points above and below the "x-axis"? Were these the Top 10 chart hits for these various years, or where did these songs come from? In my opinion, there is a strong lacking of representation for popular country in recent years, as country music has gained popularity in the past decade and a half, or so. Finally, where are the definitions for these genres coming from? For example, I'm not entirely sure I'd classify Rihanna as an R&B musician.
 -
 *By having the size of the dot represent the amount of times it was favorited and its location on the y-axis represent its popularity aren't you factoring in how well liked the song is multiple times? How do you differentiate between pop and vocal pop, or any two genres for that instance? Can a song be counted in multiple genres? anyqs

tumblr_lxlrr3d76k1r9uh7uo1_500.jpg (500×558) - 9 views

Reducing Your Chances of Dying in a Plane Crash - 4 views
-
 The question that really jumps out at me is in the section with the greyscale plane diagrams - Do the planes with the most fatalities also have more cumulative flights? The ratio of planes in service to accidents gives some scaling data, but it's entirely possible that the seemingly dangerous Boeing 737 family has made many more cumulative flights than its counterparts. "anyqs?"
 - ...3 more comments...
-
 In the display of the number of crashes by month, does the thickness of the circle represent anything in the data because some circles are thicker than others, or are the numbers being compared just based on the diameter of the circles?
 -
anyqs In the second display, I'm confused with in ratio of the number of the planes in service to fatal accidents. The ratio is interpreted as an indicator of the safety factor of the plane. However, in my opinion, the larger plane is taking a higher risk of suffering more casualties rather than comparing their in service ratios.


Digg vs Reddit [Infographic] - Rate Rush - 1 views
-
 anyqs This is a very interesting infographic because I use both diig and reddit and most of the information follows a pattern I have noticed. But I feel it could be better if it also shows the number of users that use both sites.

RealClearPolitics - 2012 Election Maps - Battle for White House - 2 views
-
 anyqs What polling statistics were used and what were the cut-offs for each category?
Pew Global Attitudes Project - 1 views
-
Found some of the surveys interesting and controversial

Playing Time for Each MLB Team - 2 views
-
 anyqs I'd love to see other stats about each team to go along with time played. Runs scored and runs against is the first thing I thought of when I saw Boston/NYY at the top and SEA at the bottom. Pitches per plate appearance could also be interesting, as could the number of extra inning games. I would also love to see number of nationally televised games because the ESPN/FOX games tend to have longer commercial breaks.
 - ...1 more comment...
-
anyqs this seems like way to simple of a figure for what it could display. The overall total playing time for a team would, in my opinion, not be as interesting as comparing players across teams or maybe including the post season
-
 anyqs As an exchange student, I am not familiar with MLB. Whether each team has to play the same number of games each season? From this chart, I thought it was not with grate help. Because the data are close to each other and I am not sure whether the different color have different meanings
FiveThirtyEight: Live Coverage of South Carolina Primary - NYTimes.com - 1 views
-
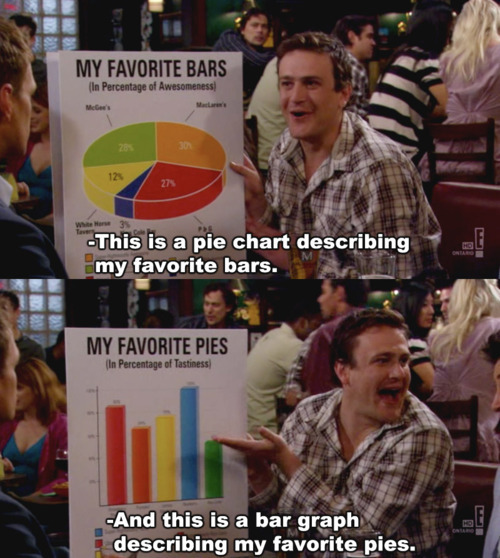
Note the lack of pie charts here...
-
 anyqs How was the chance of winning calculated based on the percent voting range? I feel like theres an easy formula for this, it's just not immediately obvious (to me anyway).

The New York Times' Cascade: Data Visualization for Tweets [VIDEO] - 2 views
-
Has a couple of videos with very detailed data visualization techniques employed by the New York Times to monitor the way their social media articles propagate through the internet. It evolves with time and shows many variables including the number of user's reading it and their locations.

Where the Trees Are : Image of the Day - 7 views
-
 anyqs How has the tree distribution has changed since 2002? It would be valuable to see areas of recent over-logging in red and areas of new growth in a lighter green.
 -
 anyqs This visualization is pretty interesting however I feel its lacking something to compare it to. I wonder how this tree distribution differs from the pre-industrial revolution distribution? Is today's tree distribution worse than before because of pollution and over-foresting? I also agree with Taylor, I think a different color like red to show recent over-logging would be very valuable to the viewer. anyqs
 -
 anyqs I wonder how the distribution of trees in the North West would change if we counted trees, not Biomass in tonnes, since so many of the trees there are large Redwoods which are considerably heavier trees due to their size.

The Greatest Basketball Players of All Time | Tableau Software - 6 views
-
Statistically shows who should be considered the greatest basketball players of all time based on different accomplishments.
-
 "anyqs" This is a very cool way to see how players from the past rack up to one another. One of my questions is how did they come up with a a methodology to rank the award achievement points, and do they believe this method can be used to rank all players versus one another? It seems like using this method, guys who have played with multiple championship teams who are not considered stars could then rank really highly, even though they might not have played a huge role in the championships won (NBA championships are the most achievement points). If all the NBA players were put on this chart, then some people could be mislead, as a guy like Charles Barkley could rank lower than say Derek Fisher, even though Fisher would is not considered on the same star level as Barkley.
 -
 anyqs How was the scoring of the achievement decided? For example, why is the pointage for Playoff Appearances 0? And it seems like there's a significant penalty for people who've never won a championship, despite their skill level. Is it fair to discount a player's all time greatness, if they were never on a team good enough to win a championship? Like John Stockton, one of the greatest point guards of all time. Leads the league in career assists by over 4000 (with 15,000+), but is given a very low ranking for his skill and effect on the game, because of his lack of rings. There's an odd skew, and while championship rings are a massive deal, they're not everything.

Urban Omnibus » Let's Talk About Maps 2 - 4 views
-
I think these maps are much nicer than the color maps that I found in my high school history classes. The 3D aspect of them is much nicer than the heat maps I have become accustomed to. They really allow you to see the how many more people live in some regions than in others. anyqs
-
 The graph of the population distribution of the US is a very interesting statistical representation. There is one outlying area that I noticed. In southern Florida there seems to be a very sparsely populated area and this map brings up the question of why this would be the case. Most of the coast surrounding this area is densely populated, so is there a geographic barrier there that prevents dense human settlement? anyqs
Vehicles involved in fatal crashes - 1 views
-
:)
-
I wonder how many were alcohol related since the days with the most wrecks were Fri, Sat, and Sun?
-
It would be interesting to compare the number of cars on the road to the number of fatal crashes, or even the total number of crashes to fatal crashes.

American Dudes and Fast Food - 7 views
-
Why are straws included in the most loved things at McDonalds? Wouldn't straws be included in Shakes? Although I guess you can eat a shake with a spoon :P Secondly, McDonalds is ubiquitous. How can they make conclusions about customer's "loyalty" when some people may not even have a chipotle, the restaurant with the lowest "loyalty", near them? anyqs
-
 anyqs I'm curious about the socioeconomic status of the customers and how they order off the menu. From my experience as a McDonald's employee, the lower-income bracket orders off the dollar menu, while families order value-meals and kids-meals, but that's just personal observations. I am curious to see if there is an actual relationship between the two.
 -
 anyqs Im curious as how they can even begin to compare McDonalds and Chipotle in the first place? It would have been easier for them to just compare them to eating at a non fast food restaurant than a specific one. SOme of the people sampled might not even enjoy chipotle. Also, I dont understand why the hot sauce portion is even included in the data. It doesn't seem to correlate with the rest of the data.